INTRODUCTION
Data from the US Census Bureau was obtained, manipulated, and joined to produce two Wisconsin county maps. A web map was then developed and manipulated from the previous map document. This lab showcases the ability to navigate, query, and obtain data and shapefiles from the US Census Bureau. Further skills of data manipulation and data joining were developed using MS Excel and ArcMap. After producing a cartographically-pleasing map, basic introduction to web mapping was then performed.
METHODOLOGY
Data Manipulation
Wisconsin population per county was obtained from the US Census Bureau by searching and downloading the correct CSV file. Data was then opened in MS Excel and unneeded categories were deleted and periods were switched to underscores to prevent errors when transferring data to ArcMap. Manipulated data was then saved as an MS Excel file.
Joining Tables to Shapefiles
Returning to the US Census Bureau website, the shapefile for Wisconsin counties was downloaded. After obtaining the shapefile and data, ArcMap was used to map the information. The MS excel file was then joined with the shapefile creating a join based on the identical GEO_ID column of both features. Data for Wisconsin county population was then switched from a string field type to a floating by adding a new field and calculating based off the original data.Mapping
Data was then mapped into a choropleth map divided into quantiles to accurately show four distinct classes of population among Wisconsin counties. All other map elements were then added and colors adjusted to make a cartographically-pleasing map.
After this was completed, the process was repeated, instead mapping the widowed population in Wisconsin counties. Maps were then joined into a single landscaped map document.
Web Mapping
The population of Wisconsin counties was then transformed into an online map through ArcGIS Online. First, the basemap and standalone table was removed from the document and re-saved. A user account through ArcGIS Online was logged into and an the University of Wisconsin-Eau Claire's enterprise was accessed. Next, a feature service was published through the university's private enterprise.
The university's private enterprise webpage was then accessed from the browser. By navigating to the My Content tab and Add layer to map, the Wisconsin county population map was uploaded. Adjustments were made to the pop-up window to show county name and population total when the cursor was placed over each county.
RESULTS
Figure 1 shows the first map produced after US Census data was obtained, manipulated, and joined. The choropleth map shows Wisconsin county population divided by quantiles.
 |
| Figure 1 |
Figure 2 shows the same process replicated but for the widowed population above the age of 15 in Wisconsin counties. The choropleth map is divided by five classes of equal intervals.
 |
| Figure 2 |
Figure 3 shows both of these Wisconsin county maps brought together in a unified landscape view.
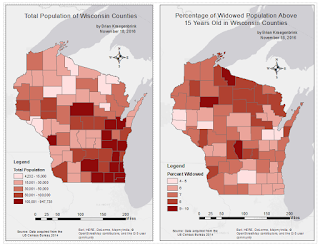

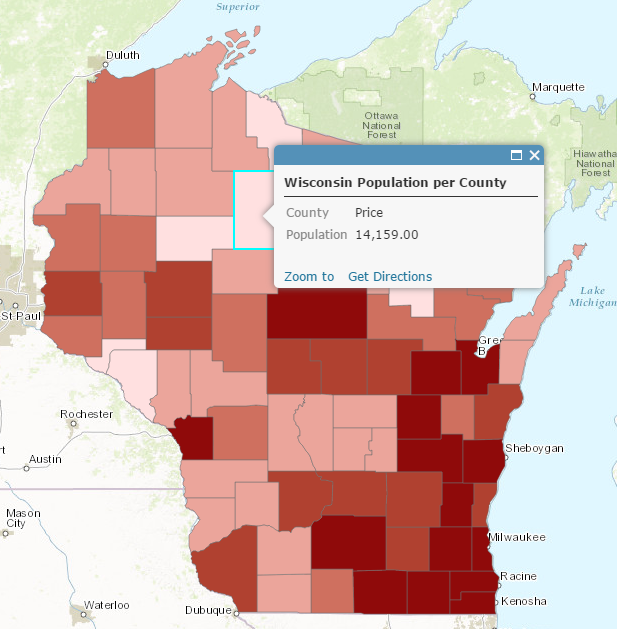
Figure 4 shows the results of web mapping through ArcGIS using the Wisconsin county population map produced in Figure 1. Each county shows the county name and total population.
SOURCES
All data was obtained from the US Census Bureau 2014.
No comments:
Post a Comment